

Usage & Quotas
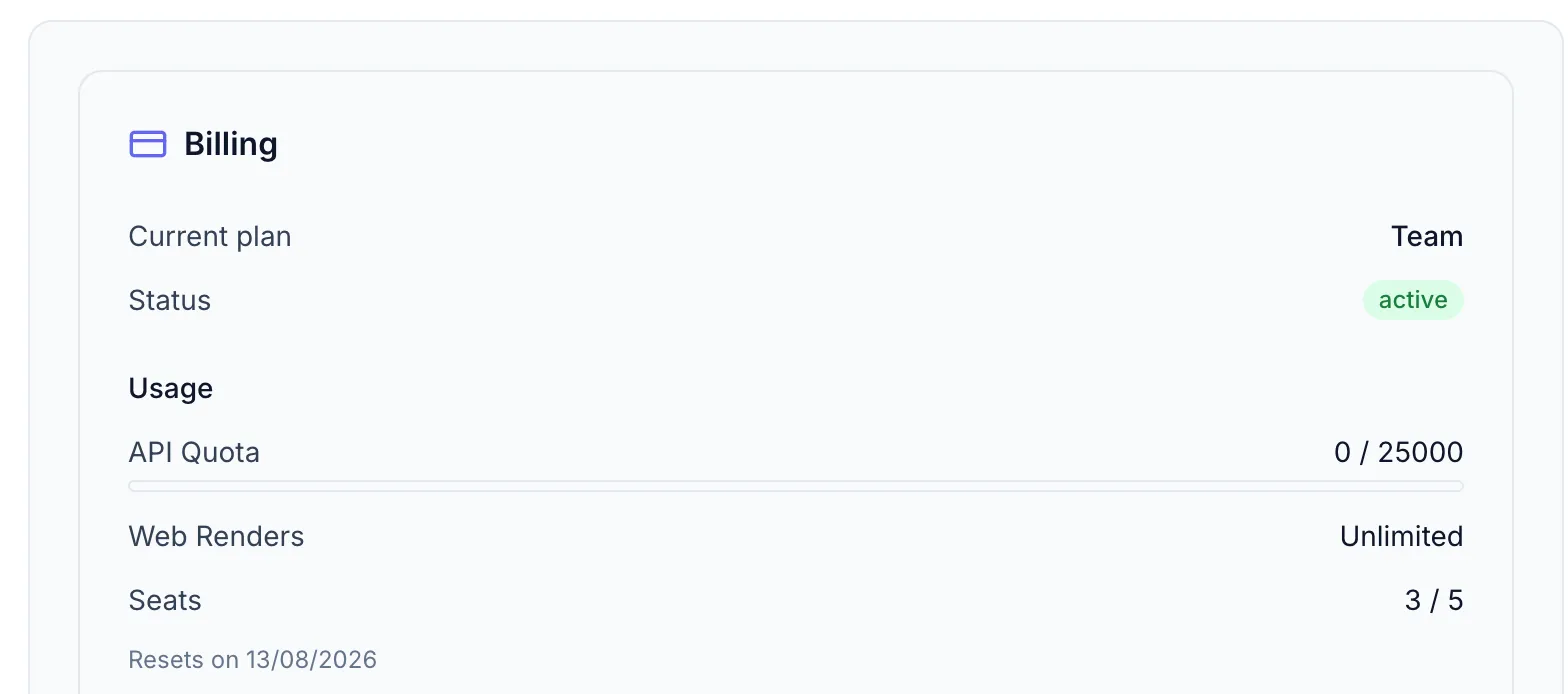
Quota bars
Section titled “Quota bars”In Settings → Billing two usage bars show your current consumption:
| Bar | What it tracks |
|---|---|
| API Quota | Renders triggered via the API (programmatic) |
| Web Renders | Renders triggered from the Generate dialog in the Designer |
Each bar shows used / limit and resets on a monthly cycle. The bar color shifts from green → yellow → red as you approach the limit.
Limits by plan
Section titled “Limits by plan”Web-render and API-render quotas and the maximum output resolution vary by plan. For the current per-plan limits, see the Zandovi pricing page or the Plans page (/plans) in the app, where limits are loaded live. See also Choosing a Plan.
Quota reset
Section titled “Quota reset”Both quotas reset on the same day each month (your billing anniversary). The Resets in X days label underneath each bar tells you how long until the next reset.
Share links are not metered as renders
Section titled “Share links are not metered as renders”Publishing a share link doesn’t consume quota. Clicking Share on a preview publishes the image already on screen — no second render, no second charge.
Things that do cost renders:
- Render & Share for PDF, which has no inline preview and so renders on demand.
- A
POST /generatecall withdelivery: "link"— that’s a render like any other; the delivery mode doesn’t change what it costs. - Batch jobs — one render per row, charged when the job is submitted. A CSV batch from the Designer draws from Web Renders; a batch job submitted via the API draws from API Quota. Cancelling a batch job refunds every row that hadn’t rendered yet, so you only pay for the images actually produced.
What share links are limited by instead is retention (how long a link lives) and the number of active links your workspace can hold at once. Both vary by plan; current values are on the Plans page (/plans).
Team usage dashboard
Section titled “Team usage dashboard”On the Team plan, Admins and Owners can see a per-member and per-API-key breakdown in Settings → Usage (bar chart icon). This helps identify which team members or integrations are consuming the most renders.
What happens when you hit the limit
Section titled “What happens when you hit the limit”- API renders: Requests return a
429 Too Many Requestserror. - Web renders: The Generate dialog shows an error when the quota is exceeded.
Upgrade your plan or wait for the next reset. See Choosing a Plan.